I’ve been spending some time recently thinking about the Discrete Fourier Transform (DFT), as well as the Fast Fourier Transform (FFT) which provides a computationally efficient means of calculating the DFT of a signal.
The DFT is defined as follows. Given a discrete-time sequence x[n] where n = 0,1,2,….,N-1
![X[k] = \sum\limits_{n=0}^{N-1} x[n] e^{-\frac{jkn2\pi}{N}}](http://s0.wp.com/latex.php?latex=X%5Bk%5D+%3D+%5Csum%5Climits_%7Bn%3D0%7D%5E%7BN-1%7D+x%5Bn%5D+e%5E%7B-%5Cfrac%7Bjkn2%5Cpi%7D%7BN%7D%7D+&bg=ffffff&fg=333333&s=2 "X[k] = \sum\limits_{n=0}^{N-1} x[n] e^{-\frac{jkn2\pi}{N}}")
De Moivre’s Theorem tells us that
 + jsin(\theta)")
Therefore, we can rewrite the DFT summation as separate expressions for the real and imaginary part of X[k] as follows (assuming x[n] is real).
![X[k] = X_{re}[k] + jX_{im}[k]](http://s0.wp.com/latex.php?latex=X%5Bk%5D+%3D+X_%7Bre%7D%5Bk%5D+%2B+jX_%7Bim%7D%5Bk%5D+&bg=ffffff&fg=333333&s=2 "X[k] = X_{re}[k] + jX_{im}[k]")
where
![X_{re}[k] = \sum\limits_{n=0}^{N-1} x[n].cos(\frac{jkn2\pi}{N})](http://s0.wp.com/latex.php?latex=X_%7Bre%7D%5Bk%5D+%3D+%5Csum%5Climits_%7Bn%3D0%7D%5E%7BN-1%7D+x%5Bn%5D.cos%28%5Cfrac%7Bjkn2%5Cpi%7D%7BN%7D%29+&bg=ffffff&fg=333333&s=2 "X_{re}[k] = \sum\limits_{n=0}^{N-1} x[n].cos(\frac{jkn2\pi}{N})")
and
![X_{im}[k] = -\sum\limits_{n=0}^{N-1} x[n].sin(\frac{jkn2\pi}{N})](http://s0.wp.com/latex.php?latex=X_%7Bim%7D%5Bk%5D+%3D+-%5Csum%5Climits_%7Bn%3D0%7D%5E%7BN-1%7D+x%5Bn%5D.sin%28%5Cfrac%7Bjkn2%5Cpi%7D%7BN%7D%29+&bg=ffffff&fg=333333&s=2 "X_{im}[k] = -\sum\limits_{n=0}^{N-1} x[n].sin(\frac{jkn2\pi}{N})")
As part of my thought process, I’ve been sketching out different implementations of the DFT and FFT in C and MATLAB/Octave. This one struck me as particularly nice because it’s a very plain and simple DFT by brute force.
//
// dft.c - Simple brute force DFT
// Written by Ted Burke
// Last updated 7-12-2013
//
// To compile:
//    gcc dft.c -o dft.exe
//
// To run:
//    dft.exe
//

#include <stdio.h>
#include <stdlib.h>
#include <math.h>

#define N 16
#define PI2 6.2832

int main()
{
	// time and frequency domain data arrays
    int n, k;             // indices for time and frequency domains
    float x[N];           // discrete-time signal, x
    float Xre[N], Xim[N]; // DFT of x (real and imaginary parts)
    float P[N];           // power spectrum of x

    // Generate random discrete-time signal x in range (-1,+1)
    srand(time(0));
    for (n=0 ; n<N ; ++n) x[n] = ((2.0 * rand()) / RAND_MAX) - 1.0;

    // Calculate DFT of x using brute force
    for (k=0 ; k<N ; ++k)
    {
        // Real part of X[k]
        Xre[k] = 0;
        for (n=0 ; n<N ; ++n) Xre[k] += x[n] * cos(n * k * PI2 / N);

        // Imaginary part of X[k]
        Xim[k] = 0;
        for (n=0 ; n<N ; ++n) Xim[k] -= x[n] * sin(n * k * PI2 / N);

        // Power at kth frequency bin
        P[k] = Xre[k]*Xre[k] + Xim[k]*Xim[k];
    }

    // Output results to MATLAB / Octave M-file for plotting
    FILE *f = fopen("dftplots.m", "w");
    fprintf(f, "n = [0:%d];\n", N-1);
    fprintf(f, "x = [ ");
    for (n=0 ; n<N ; ++n) fprintf(f, "%f ", x[n]);
    fprintf(f, "];\n");
    fprintf(f, "Xre = [ ");
    for (k=0 ; k<N ; ++k) fprintf(f, "%f ", Xre[k]);
    fprintf(f, "];\n");
    fprintf(f, "Xim = [ ");
    for (k=0 ; k<N ; ++k) fprintf(f, "%f ", Xim[k]);
    fprintf(f, "];\n");
    fprintf(f, "P = [ ");
    for (k=0 ; k<N ; ++k) fprintf(f, "%f ", P[k]);
    fprintf(f, "];\n");
    fprintf(f, "subplot(3,1,1)\nplot(n,x)\n");
    fprintf(f, "xlim([0 %d])\n", N-1);
    fprintf(f, "subplot(3,1,2)\nplot(n,Xre,n,Xim)\n");
    fprintf(f, "xlim([0 %d])\n", N-1);
    fprintf(f, "subplot(3,1,3)\nstem(n,P)\n");
    fprintf(f, "xlim([0 %d])\n", N-1);
    fclose(f);

	// exit normally
    return 0;
}
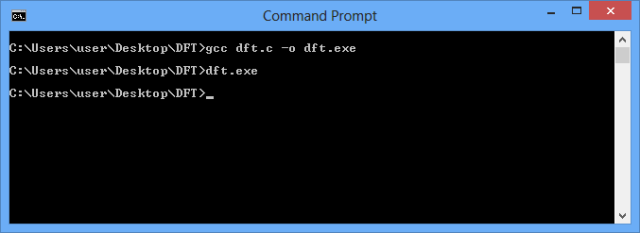
To compile and run the above code, do the following:
When you run the executable file dft.exe, it writes an M-file called dftplots.m which can then be run in MATLAB or Octave to produce plots of the results. This is the M-file produced by dft.exe:
n = [0:15];
x = [ -0.763848 0.445723 0.350261 0.036225 -0.217444 0.121921 -0.604968 0.623280 -0.966613 0.806513 -0.387738 0.412580 0.580554 0.705191 0.440352 -0.077792 ];
Xre = [ 1.504196 0.561935 -1.724586 -1.655775 -1.165293 -0.460708 -2.462571 2.365616 -4.643086 2.365602 -2.462494 -0.460714 -1.165152 -1.655658 -1.724676 0.561582 ];
Xim = [ 0.000000 1.771657 -0.359353 -1.262270 -1.085051 -0.100950 -0.105040 -0.259128 0.000203 0.258721 0.105206 0.100861 1.085066 1.262431 0.359592 -1.771775 ];
P = [ 2.262606 3.454538 3.103332 4.334917 2.535245 0.222443 6.075290 5.663288 21.558247 5.663008 6.074944 0.222430 2.534947 4.334937 3.103816 3.454561 ];
subplot(3,1,1)
plot(n,x)
xlim([0 15])
subplot(3,1,2)
plot(n,Xre,n,Xim)
xlim([0 15])
subplot(3,1,3)
stem(n,P)
xlim([0 15])
I ran dftplots.m in Octave, as shown below:

It produced the following graphs:

The top plot is the original random discrete-time sequence x[n]. The second plot shows the real and imaginary parts of X[k]. Note the symmetry of X[k], which is just as we expect for real x[n]. The final plot is P[k], the power spectrum of x[n]. Basically, each value of P[k] is the square of the magnitude of the corresponding complex value X[k]. Again the symmetry is just as we expect for real x[n].

